Login
The New HTML5-based Online Viewer Tool for ECG Traces
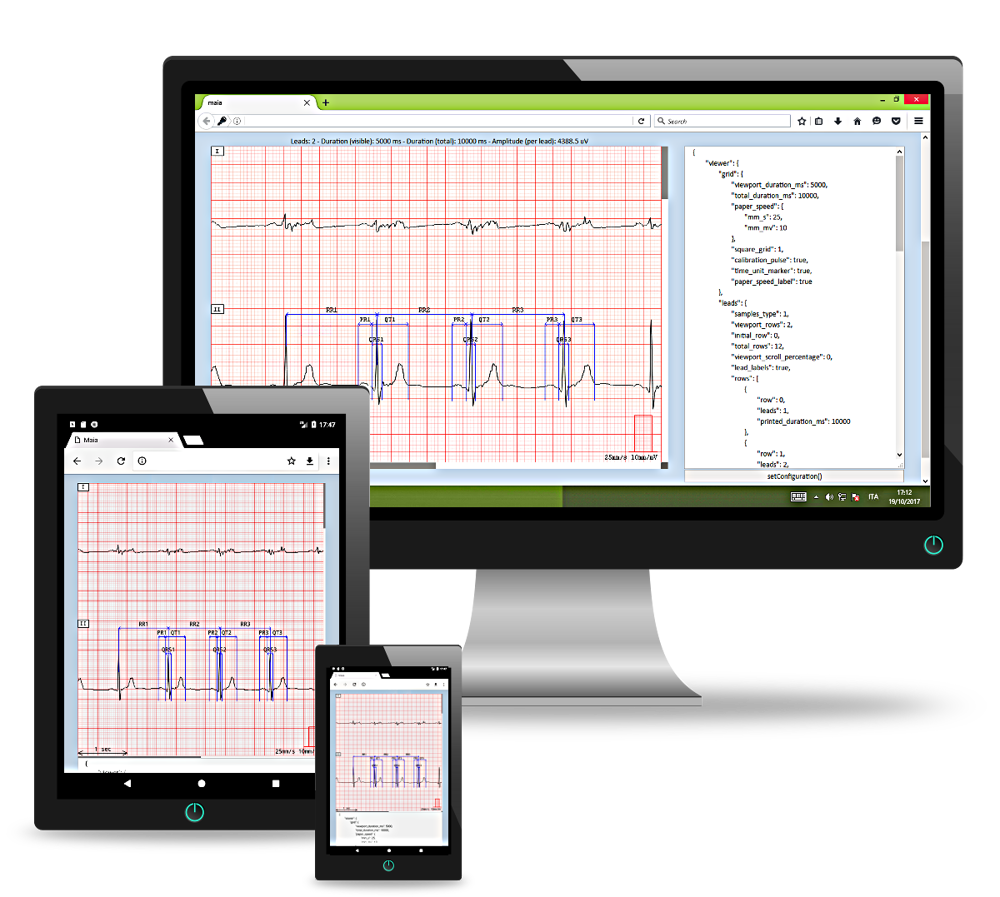
Introducing ViewECG Web! AMPS growing list of software tools now includes ViewECG Web - a JavaScript library designed for fully-customizable display of digital ECGs viewed by your HTML5 web browser. Our new software tool leverages the ease of the Internet to deliver a display of ECGs.
With ViewECG Web, you can customize the display of digital ECGs enabling the end-user to interact with the rendered digital ECG. The dynamics of this tool are perfect to support standard healthcare industries, plus the pharmaceutical industry.
ViewECG Web is a fully adaptable web browser ECG viewer based on the HTML 5 standard. Our new display solution supports these browser/operating systems:
- Google Chrome for Windows
- Google Chrome for Android
- Firefox for Windows
- Microsoft Internet Explorer 10+
- and EDGE for Windows
This ECG Web Viewer can support inputs in the AMPS binary file format, and allows the visualization of both: 10s Rhythm strip and Representative Beats.
The Viewer supports the display of both 10s Rhythm strip and Representative Beats and brings to users the possibility to render the ECG waveforms entirely. ViewECG Web also has the ability to display ECG waveforms in the various standard layouts:
- Rhythm 12x1
- Rhythm 6x2
- Rhythm 6x2 and Long Lead
- Rhythm 3x4
- Rhythm 3x4 and Long Lead
- Rhythm Superimposed
- Representative Beat 12x1
- Representative Beat 6x2
- Representative Beat 6x2 and Superimposed
- Representative Beat 3x4
- Representative Beat 3x4 and Superimposed
- Representative Beat Superimposed
Users can filter the waveform and the application permits a real-time measurement of both time and amplitude annotations using the digital caliper.
ViewECG Web supports both ECG annotations from input ECG file and ECG annotations passed through the API (Application Programming Interfaces) from the client application.
With this set of APIs the can customize ECG visualization, to control:
- ECG layout
- Paper speed
- Number of leads
- Scrolling
- Zooming
Annotations embedded in the input ECG file can also be displayed and the ECG waveforms can be filtered.
ViewECG Web more
VIewECG Web displays ECG waveforms in these standard layouts:
- Rhythm 12x1
- Rhythm 6x2
- Rhythm 6x2 and Long Lead
- Rhythm 3x4
- Rhythm 3x4 and Long Lead
- Rhythm Superimposed
- Representative Beat 12x1
- Representative Beat 6x2
- Representative Beat 6x2 and Superimposed
- Representative Beat 3x4
- Representative Beat 3x4 and Superimposed
- Representative Beat Superimposed

Example: ECGs displayed in "Representative Beat 3x4" format

Example: ECGs displayed in "Rhythm 6x2" format

Example: ECGs displayed in "Rhythm 12x1" format

Example: ECGs displayed in "Rhythm 3x4 and Long Lead II" format
VIewECG Web supports ECG annotations beyond the ECG trace display. The annotations can be retrieved from the input file or passed through a specific API.

Example: ECG visualization with annotations.
ViewECG Web provides the following user interactions:
- Horizontal scroll: Scroll the ECG waveforms along the time axis by using the horizontal scroll-bar at the bottom of the Viewport (in a PC browser) or moving one finger horizontally through the Viewport (in a mobile browser with touchscreen support).

Example: The first 5 seconds of the selected ECG are displayed on the viewport. The horizontal scroll-bar at the bottom of the representation is enabled.

Example: Horizontal scroll gesture for mobile browser.
- Vertical scroll: When the number of leads (rows) visualized in the viewport is less than the total number of rows, the user can select any specific lead of interest which can be displayed by using the vertical scroll-bar on the right of the ECG waveforms (in a PC browser) or moving a finger vertically through the Viewport (in a mobile browser with touchscreen support).

Example: In the viewport only lead II is displayed.

Example: Vertical scroll gesture for mobile browser.
- Zoom: Increase or decrease the visible seconds by turning the mouse wheel up/down (in a PC browser) or moving two fingers inside the Viewport (in a mobile browser with touchscreen support).

Example: Pinch to zoom gesture for mobile browser.
- Manual caliper: Manually measure Time (i.e. duration) and Voltage (i.e. amplitude) with the available manual calipers (if enabled).

Example: horizontal time-caliper to manually measure time intervals.

Example: vertical voltage-caliper to manually measure amplitude intervals.
Through a set of available APIs, it’s possible to customize the ECG visualization from the Client application:
- ECG layout
- Paper speed
- Number of leads
- Scrolling
- Zooming


